What's new in Databricks - January 2025
January 2024 Release Highlights
Failed tasks in continuous jobs are now retried
Stats collection is automated by predictive Optimization
Data Engineering
Delta live tables now supports publishing to tables in multiple schemas and catalogs
By default, new pipelines created in Delta Live Tables now support creating and updated materialized views and streaming tables in multiple catalogs and schemas.
The new default behavior for pipeline configuration requires that users specify a target schema that becomes the default schema for the pipeline. The LIVE virtual schema and associated syntax is no longer required.
Platform
Stats collection is automated by predictive optimization
Predictive Optimization now automatically calculates statistics for managed tables during the write operation and automated maintenance job.
With predictive optimization enabled, Databricks automatically does the following:
Identifies tables that would benefit from maintenance operations and queues these operations to run.
Collects statistics when data is written to a managed table.
Failed Tasks in continuous jobs are now automatically retried
This release includes an update to Databricks Jobs that improves failure handling for continuous jobs. With this change, task runs in a continuous job automatically retry when a run fails. The task runs are retried with an exponentially increasing delay until the maximum number of allowed retries is reached
Notebooks improvement
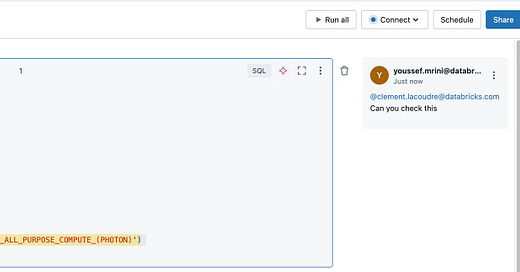
You can now mention users directly in comments by typing “@” followed by their username. Users will be notified of relevant comment activity through email
The Databricks Assistant chat history is available only to the user who initiates the chat.
Notebooks are now supported as workspace files. You can now programmatically write, read, and delete notebooks just as you would any other file. This allows for programatic interaction with notebooks from anywhere the workspace filesystem is available.
When you first open a notebook, initial load times are now up to 26% faster for a 99-cell notebook and 6% faster for a 10-cell notebook.
The following improvements have been made to the notebook output experience:
Is one of filtering: In the results table, you can now filter a column using Is one of and choose the values you want to filter for. To do this, click the menu next to a column and click Filter. A filter modal will open for you to add the conditions you want to filter against.
Result table copy as: You can now copy a result table as CSV, TSV, or Markdown. Select the data you want to copy, then right-click, select Copy as, and choose the format you’d like. Results are copied to your clipboard.
Download naming: When you download the results of a cell, the download name now corresponds to the notebook name
OAuth token federation is now available in Public preview
Databricks OAuth token federation allows you to securely access Databricks APIs using tokens from your identity provider. OAuth token federation eliminates the need to manage Databricks secrets such as personal access tokens and Databricks OAuth client secrets.
GenAI
Optimize RAG applications with Semantic Caching on Databricks
Using GenAI and Traditional ML for Anomaly and outlier detection
Serving Vision Language Models on databricks
Meta Llama 3.3 now powers AI Functions that use Foundation Model APIs
AI Gateway now supports provisioned throughput
Mosaic AI Gateway now supports Foundation Model APIs provisioned throughput workloads on model serving endpoints.
You can now enable the following governance and monitoring features on your model serving endpoints that use provisioned throughput:
Permission and rate limiting to control who has access and how much access.
Payload logging to monitor and audit data being sent to model APIs using inference tables.
Usage tracking to monitor operational usage on endpoints and associated costs using system tables.
AI Guardrails to prevent unwanted data and unsafe data in requests and responses.
Traffic routing to minimize production outages during and after deployment.
AIBI
AI/BI dashboards
Download as PDF: You can now download a PDF copy of a published dashboard. Download a published dashboard.
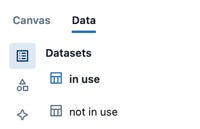
Visually identify datasets in use: A visual indicator now marks whether datasets in the data tab are used in visualizations on the canvas. Datasets that support canvas widgets have a blue icon and a bolded title. Unused datasets have a grey icon and a non-bolded title.
Generate new charts with Databricks Assistant: Databricks Assistant now supports creating dual-axis charts from natural language requests.
COUNT(*)added as a measure: When choosing fields from the visualization editor,COUNT(*)is now in the measure section.
Publish using a service principal: You can now use the REST API to publish dashboards with service principal credentials. See Use a service principal to publish and share dashboards.
Reorder datasets: Drag and drop dataset names to change their order in the Data tab.
Cross-filtering support for point maps: Cross-filtering is now available for point map charts. For a list of chart types that support cross-filtering, see Cross-filtering.
New scatter chart scaling options: A Log (Symmetric) scale function is now available for scatter charts.
Fixed range sliders: The Range slider filter now correctly limits items to those within the selected range.
Fixed tooltips: Tooltips now display accurate totals for charts with labels.
AI/BI Genie
Fixed table identifier quoting: Genie now properly quotes table name identifiers in queries by adding backticks around each part of the catalog, schema, and table name. For example,
catalog.schema.tableis now formatted as`catalog`.`schema`.`table`to preventTABLE_OR_VIEW_NOT_FOUNDerrors.Fixed ANY keyword error: Genie now replaces the
ANYkeyword with theINkeyword when querying list columns to avoid common SQL errors.Improved query descriptions: Genie now uses an updated model to generate more precise and accurate query descriptions.
See warehouse details: The Default Warehouse selector in the space settings has been updated to display status, size, and warehouse type. You can also type to filter and select warehouses.


